
A Comprehensive Step-By-Step Guide to Building an Enterprise Knowledge Graph
Contents
- Your Own Google Knowledge Graph
- Flowchart
- Step 1: Define Objectives
- Step 2: Engage Stakeholders
- Step 3: Define Knowledge Domain
- Step 4: Choose a Platform
- Before You Start
- Step 5: Building an Initial Framework
- Step 6: Grow Your Knowledge Graph
- Step 7: Create Relationships
- Step 8: Publish Your Graph
Your Own Google Knowledge Graph
Siri, Google Assistant and Alexa are powerful applications. They can only, however, produce answers from public domain knowledge, and only a small subset of public domain knowledge at that. These agents certainly can’t answer questions about your project or business and can answer very little about specific domains of expertise.
That kind of question usually results in "Here’s what I found" followed by a long excerpt of text from an indexed page which may or may not include the answer the user needs.
That’s not much use if a team member needs to know about (say) an internal security procedure. Or if a customer wants to check a key product feature.
Building your own knowledge graph gives you the power to fix this. It’s now possible for any organisation, large or small, to build question-answering knowledge graphs for themselves and for their customers using a chatbot or other messaging channel.
In this post I’m going to show you how to build a knowledge graph that can provide quick, succinct answers for your team members and your customers.
tl;dr

Step 1: Define Objectives
Before doing anything else, it’s important to define the problems your knowledge graph is going to solve. A knowledge graph can represent knowledge about every facet of your organisation and the world it operates in, and while you’re building your graph it will be tempting to add to it much more than you should.
You’ll ask yourself the question “Will we want to formalise this knowledge at some stage?” - and the answer will almost certainly be “yes”. If your knowledge graph project is to be successful, however, its scope needs to be tightly managed.
A good way to define a project’s objectives is to create simple User Stories that encapsulate the problems you want to solve. These User Stories are short needs-defining statements written from a user’s perspective and they’re a staple of Agile software development. If you’re unfamiliar with user stories, a good place to start is with statements that use the Five Ws. i.e:
As [who] [when] [where], I want [what] because [why].
Here’s an example:
As an after-hours chatbot on Facebook Messenger I want to be able to answer any question on any of our products because I want to give a potential customer everything they need to make a purchase decision wherever they want to make it.
Complete this step with a formal objectives statement that includes the user stories you’ve used to define the scope of the project.
Step 2: Engage Stakeholders

Even if you’re a small fully-autonomous department or organisation, there will be other people and teams whose needs should be factored in to your knowledge graph planning. Once you’ve defined your objectives, you’ll know who those stakeholders are.
Start by asking some questions:
- Who’s going to use the knowledge graph on a regular basis?
- Who’s going be allowed to see what’s in it?
- Who are the internal domain experts that will contribute knowledge to it?
- Who else should be encouraged to make comments and suggestions that will inform knowledge graph content?
- Who’s going to take overall responsibility for the veracity of the knowledge?
- Will you need to involve external domain experts? E.g. suppliers, customers, consultants.
- Should the graph link into other sources of knowledge such as document stores and ERP systems? Will these sources support the required deep linking?
- What are the legal, Intellectual Property or knowledge security issues and who are the gatekeepers for these concerns?
Once you’ve answered all these questions, you’ll have a better idea of the scope of the project. You may, at this stage, decide to redefine your objective statement so that you can keep stakeholder requirements to a manageable level and get your knowledge graph built more quickly.
Step 3: Define Knowledge Domain
We use the term Knowledge Domain to define the scope of a knowledge graph. Once your knowledge graph is built, your domain will be defined by the upper levels of the knowledge graph itself. For now, though, your Knowledge Domain will be described by a list of knowledge “buckets” that are meaningful to you and your experts.
List these buckets by exploring and expanding your objectives statement from Step 1.
Taking our Step 1. example user story as an example, it’s plain we’re going to need these buckets of knowledge and data:
- Products, their classifications and their descriptions.
- Product inclusions and specifications.
- Product prices.
- Warranty and service policies.
Since we’re using our graph to support omnichannel commerce, we’ll also need;
- Retailers, their classifications and their descriptions.
- Retailer addresses, phone numbers, web sites and other channels of communication.
We’ll use these buckets in Steps 5 and 6.
It's also worthwhile at this stage to compile a set of sample questions that are representative of what you expect your knowledge graph to answer. Use them to make sure that you have all the buckets you need.
Step 4: Choose a Platform
You’ll need to lock in a platform for building and managing your knowledge graph before you start building. These platforms are usually built over a Graph Database product. It's important to remember that a Graph DBMS is, like any database, just a storage layer. It's a small part of any knowledge graph platform's functionality.
Choosing a knowledge graph platform is an important decision, because you’ll almost certainly be stuck with that platform for the life of your graph. Although RDF triples can reside in any Triplestore and there are some query languages that can be used across several Property Graph DBMS products – in general you should assume that the knowledge graph you build in one technology will not be transferable to another.
Some general considerations...
- Is the total cost of running a graph using it within your budget?
- If it’s an Open Source platform, can your organisation work with its license terms?
- Does it support your preference to run it in-house or in the cloud?
- Will you need external or interdepartmental resources to set it up and manage it?
- Are there internal policies which require or preclude its use?
More specifically…
- Can you meet your Step 1 objectives using it?
- Does it come with, or can you easily plug in an existing ontology or taxonomy?
- Will you be able to use its tools, SDKs and APIs to load concepts in bulk?
- Can your team easily collaborate using no-code tools if required?
- Are those tools safe* for use by a team with varying skills and roles?
- Will an application layer need to be written before your users can interact with the graph?
* A safe knowledge graph tool is one that makes it difficult for team members to accidentally make damaging structural changes to the graph.
Before You Start
You’ve defined our project objectives and your graph’s knowledge domain, and chosen a platform. There are, however, some key knowledge graph concepts that you may need to familiarise yourself with before you get started.
Concepts
A knowledge graph is built from Concepts. These concepts, and the relationships between them, are all there is to a knowledge graph. So it’s important that we create them with the right properties.
In a knowledge graph, a concept is a discrete entity - it’s something meaningful when it stands on its own. A concept exists just once in the graph - i.e. it represents all (∀) such entities. Ideally, we want each concept to be indivisible, but this is often not practical. At the very least, however, we need to be sure that no parts of our concept exist in some other concept.
If a concept is stripped of redundant information in this way, we should be able to describe it in one or two short paragraphs. It’s no coincidence that most of our communication is also this short. Each “turn” in a verbal and digital conversation is usually about one or two concepts and the relationship between them. Twitter recognised this when it limited tweets to 140 characters and many would argue that the short message has almost become the unit of currency for modern communication.
For commonly-used concepts, humans generally assign words. Pick up a dictionary and look up any noun word - this will give you a sense for what constitutes a concept. Bear in mind that if the word has multiple meanings, each of those meanings represents a different concept.
Reification
Why just the nouns in the above dictionary metaphor? What about the verbs, adjectives and other parts-of-speech? Concepts in a knowledge graph represent things, so they’re all nouns.
This may seem to be a limitation when modelling knowledge, but any fact can be modelled as a relationship between nouns. The French translation for “I’m hungry”, for example, illustrates how interchangeable the various parts of speech really are. In French it’s J’ai faim - "I have hunger".
When we’re adding concepts to our knowledge graph, we often need to "nounify" them first – to ensure that every concept is a thing. We refer to this process as Reification.
Containment, Subsumption and Composition
Concept A is said to contain Concept B if Concept A can be used to describe Concept B. You can also say:
Concept A has Concept B and
Concept B is of Concept A
When constructing a knowledge graph we refer to this as Simple Containment.
One type of containment is referred to as Subsumption. Subsumption is used between concepts that represent a hierarchy of concept classes. Concept A is said to subsume Concept B if you can say that:
Concept B is a Concept A.
Subsumption relationships between concepts are useful because the properties of a concept can often be inferred from their subsumption hierarchy. If a dog is a mammal we can infer that the female can produce milk, for example.
Another type of containment relationship is Composition. Concept A is composed of Concept B if you can say that:
Concept B is part of Concept A.
Composition also makes useful inference possible. If “paw” is part of “dog”, a machine might be able to assume that all dogs have paws.
There are advantages and disadvantages to the use of these containment relationships in a knowledge graph. Subsumption and Composition allow machines to apply more logic when using the graph. Simple Containment makes knowledge graphs much easier for humans to build and makes them easier to search using natural language. Our EKG and KayBot products, for example, are designed for use by humans, so they support only Simple Containment.
You’ll need to make a choice about which types of containment your graph will use, before building the Initial Framework in Step 5.
Normalisation
Normalisation is the process of creating suitable knowledge graph concepts and relationships from our knowledge and data.
The term is borrowed from Relational Database design. There are several degrees of normalisation in a Relational Database, but a Relational Database is said to be fully normalised if there is no redundancy in the data it stores. That is, if each unique field value exists only once in the data store (primary and foreign keys excluded).
This absence of redundancy is also what we’re trying to achieve when we build our knowledge graph. We want any concept to exist just once in the graph. Unfortunately most platforms used for knowledge graph creation make it too easy to introduce concept redundancy.
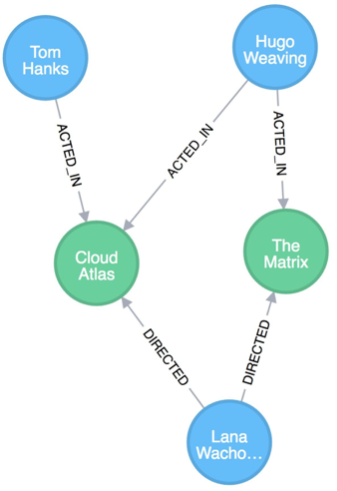
Let’s take this example from the blog of one of the world’s most popular Property Graph DBMS products.
Notice the redundancy? There are three ACTED_IN relationships and two DIRECTED relationships. Property graphs like those managed by neo4J give you the power to stuff all sorts of useful information into relationships – but just because you can, doesn’t mean you should. It makes much more sense to use (say) a single acting concept, create a director role concept, and then find a way to use those in your knowledge graph instead.
Redundancy is an even bigger problem in knowledge graphs built using the RDF model. This is due mainly to the global scope and highly expressive nature of its references and the large number of people who use it.
Whichever technology you use, the job of managing your knowledge graph and getting answers from it will be much easier if you can eliminate redundancy and ambiguity from it.
Facts
A knowledge graph fact is a relationship between two concepts. In the above example “Hugo Weaving acted in The Matrix” is a fact.
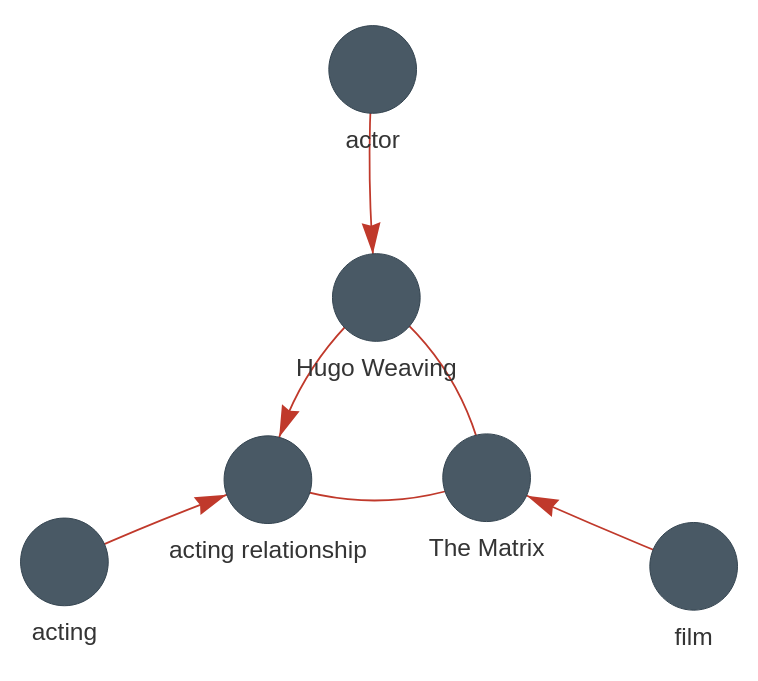
A normalised version of this fact that introduced a reified concept to the relationship might look like this.
In this new graph we have two new facts. "Hugo Weaving is an actor" and "The Matrix is a film".
Perhaps we could infer these facts from the relationships in the graph above, but The Matrix might be a stage play and Hugo Weaving might only have been an extra. Only in this second example are the facts encoded into the graph. Structuring knowledge in this way simplifies searching the graph.
As an exercise, let's remove the "acting relationship" from this graph. We no longer know that Hugo Weaving acted in The Matrix. The graph still, however, carries more useful Hugo Weaving information than the one above. A "Matrix" "Actors" set of graph traversals would certainly bring back a Hugo Weaving result.
This reduced level of accuracy is fine for many knowledge retrieval applications and it illustrates that, when building your graph, you can create useful knowledge by using simple relationships between your concepts.
Accurately encoding the nature of facts can be a challenge for your team and often it makes sense to do it later. You can safely add relationships later to a properly normalised knowledge graph in this way. We call this resilience property "graceful extension".
Human Limits

If your knowledge graph is to be used principally by humans, there are some key human limits you need to be mindful of when building it.
When a human seeks to learn or understand something, the facts of that something need to be held in working memory (short term memory) for the duration of that learning process.
Short term memory in humans is extremely limited when compared with that of a machine. No-one is too sure what that limit is, and it seems to depend on the nature of the “thing” being remembered, but seven plus-or-minus two is a good rule of thumb to work with.
Humans do have strategies that help mitigate these working memory constraints. One such strategy is chunking. Chunking is a process by which individual pieces of information are bound together into a meaningful whole.
Sensibly connecting a concept into your knowledge graph is an exercise in chunking. The concept will usually be contained by one, two or three other concepts (if simple containment is used). That group of “describing” concepts will then become a single describing chunk – represented by the new concept. A concept with descriptors "data graph" and "DBMS" becomes a "graph database" for example.
The same is true for the facts that are attached to the concept. We can only attach seven plus-or-minus two facts to a concept before those facts become a meaningless list in the mind of the human reviewing the concept. A human’s usual strategy is to group (chunk) the facts by some meaningful common attribute, but a better strategy – and the one that natural language teaches us is most common – is to create another concept that represents that group.
As an exercise to illustrate this, let’s look at the class of computing device called a “laptop”. There are thousands of different laptop variations that might each warrant their own concept in a knowledge base. 1000+ laptops as facts against a “laptop” concept would just be a meaningless list to a human. Vendors, reviewers and other entities recognise this, so they focus the attention of their audience on a meaningful subset. A retailer or reviewer might chunk (say) “premium 15 inch” laptops together. Premium 15 inch laptop is a meaningful concept for many buyers. So are “less powerful laptops of under 1kg” which the industry has already chunked under the label Ultraportable.
Where it’s practical, it makes sense to limit every concept’s fact count to single digits - so that the knowledge graph’s user can hold it in working memory and understand it as a chunk.
Step 5: Building an Initial Framework
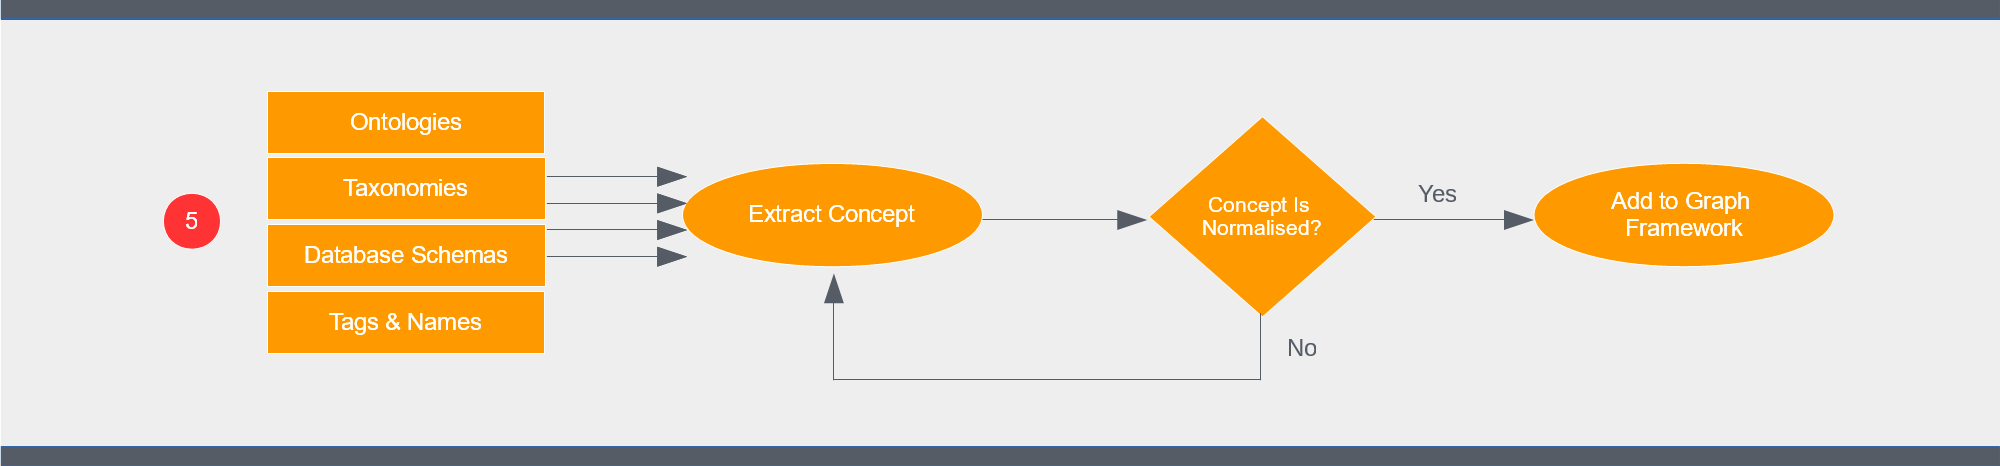
You’ll notice that the “How to Build a Knowledge Graph” flowchart has two distinct graph-building layers. A graph is a single, connected structure but it makes sense to start with a framework or scaffold to build from. This can be as simple as a tree of labels or as complex as a fully-fledged ontology. We’ll need to create this layer before continuing.
In Step 3 we listed the broad classes of data and knowledge we’d be using to construct our graph. Many of the resources we have access to will have sensible labels that we can use to inform the creation of concepts in our knowledge graph.
Where possible, we want to leverage the work of others. Closest to what will become our framework are the domain ontologies and taxonomies. If we can find one or more of these that describes our domain we’re already halfway there. These resources are a good place to start your search for knowledge frameworks that can inform the creation of your own:
- Schemas @ schema.org
- Good Ontologies @ W3C
- Upper Ontology @ Wikipedia
- Taxonomy @ Wikipedia
- List of Lists of Lists @ Wikipedia
If you're planning to build a Semantic Knowledge Graph, your framework will need language concepts that support semantic search. One of the Upper Ontologies will be your best starting point.
Internally, you’ll also have a number of useful resources. Review the names of tables and columns in your relational databases and the names used in JSON and XML document schema. Your IT team should be happy to provide you with these. The tags used in your knowledge bases, productivity software and social media posts can also inform the creation of framework concepts.
You’ll have decided what types of containment your graph will use. If you’re building from an existing ontology or framework, start adding the missing concepts to it using these containment relationships. If you’re building the knowledge graph for humans, also remember their working memory limits. Don’t be afraid to make category and sub-category concepts that will end up with a manageable number of facts.
A “no-code” tool is best for creating the Initial Framework. If the platform you’re using doesn’t have one, you’ll need to engage the services of a developer.
The Initial Framework needs to cover everything described in your Knowledge Domain statement. It should be comprehensive enough and self-explanatory enough that your team and our experts never need to ask “Where do I attach this concept” when adding to your graph.
Building a knowledge graph framework doesn’t need to be a big job. Our EKG and KayBot SaaS offerings, for example, come with a comprehensive framework of concepts derived from Princeton University’s Wordnet. We generally find that a Client needs to add fewer than a hundred concepts to this framework to get them started.
Step 6: Grow Your Knowledge Graph
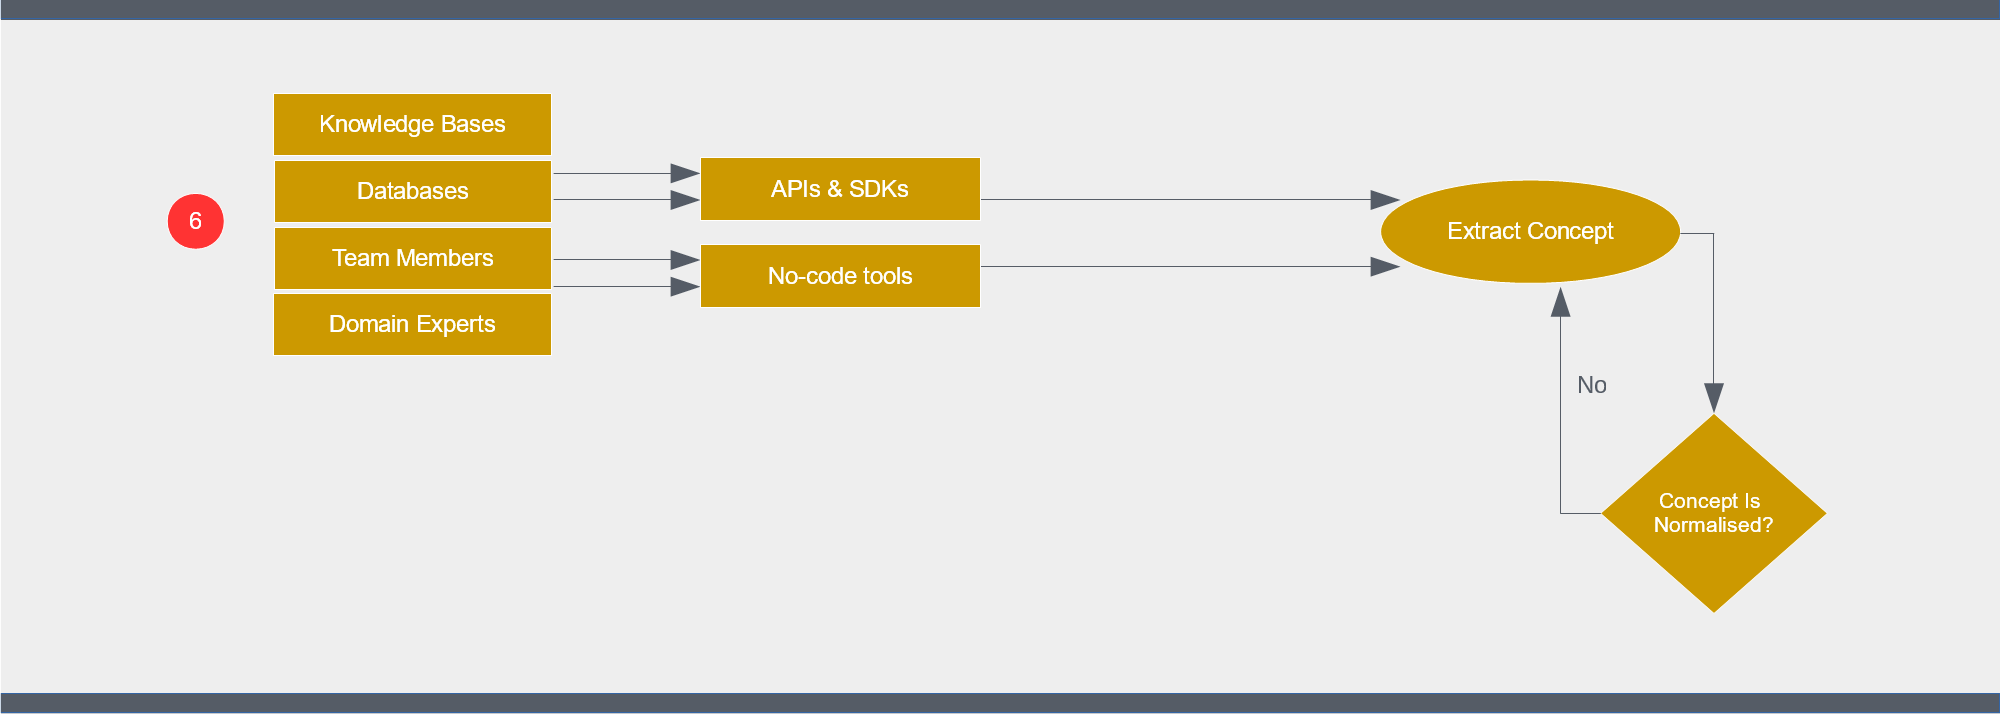
In this phase we’re going to put enough into our knowledge graph to meet the knowledge graph objectives defined in Step 1.
Do any “bulk” loading of concepts first. You’ll need a software developer for this and they’ll work using your Knowledge Graph platform’s SDK or API. You’ll also need access to the existing databases and knowledge bases you’ll be extracting concepts from. Your developer will know who in your IT Operations team can provide that access.
If your knowledge graph platform has easy-to-use and safe no-code tools, it will be time to then get your domain experts and other team members fully engaged.
Bulk-loaded concepts will usually require some correction. There’s also plenty of scope to further connect these concepts within your graph. Get your team to browse each concept looking for connections to make.
Many missing concept “holes” will become apparent as you attempt to add more connections. Many more holes will show up when you test your graph using the list of queries (and variations of them) that you compiled in Step 3. Get your team to create and connect concepts that will fill the holes.
It may not be possible to load concepts to your knowledge graph in bulk. If that’s the case, you’ll have established this during your “Choose a Platform” step and opted for a platform with simple, collaborative, no code tools. Simple tools and the collaboration of a knowledgeable team will get the job done.
Not every team member should be given the power to make changes – but every team member should be able to share their observations and suggestions about what’s in your knowledge graph. Some knowledge graph tools allow notes to be recorded against concepts – notes that can inform the editing process. For those tools that don’t – let your non-editor team members make comments in an issue tracking application or shared document.
Step 7: Create Relationships
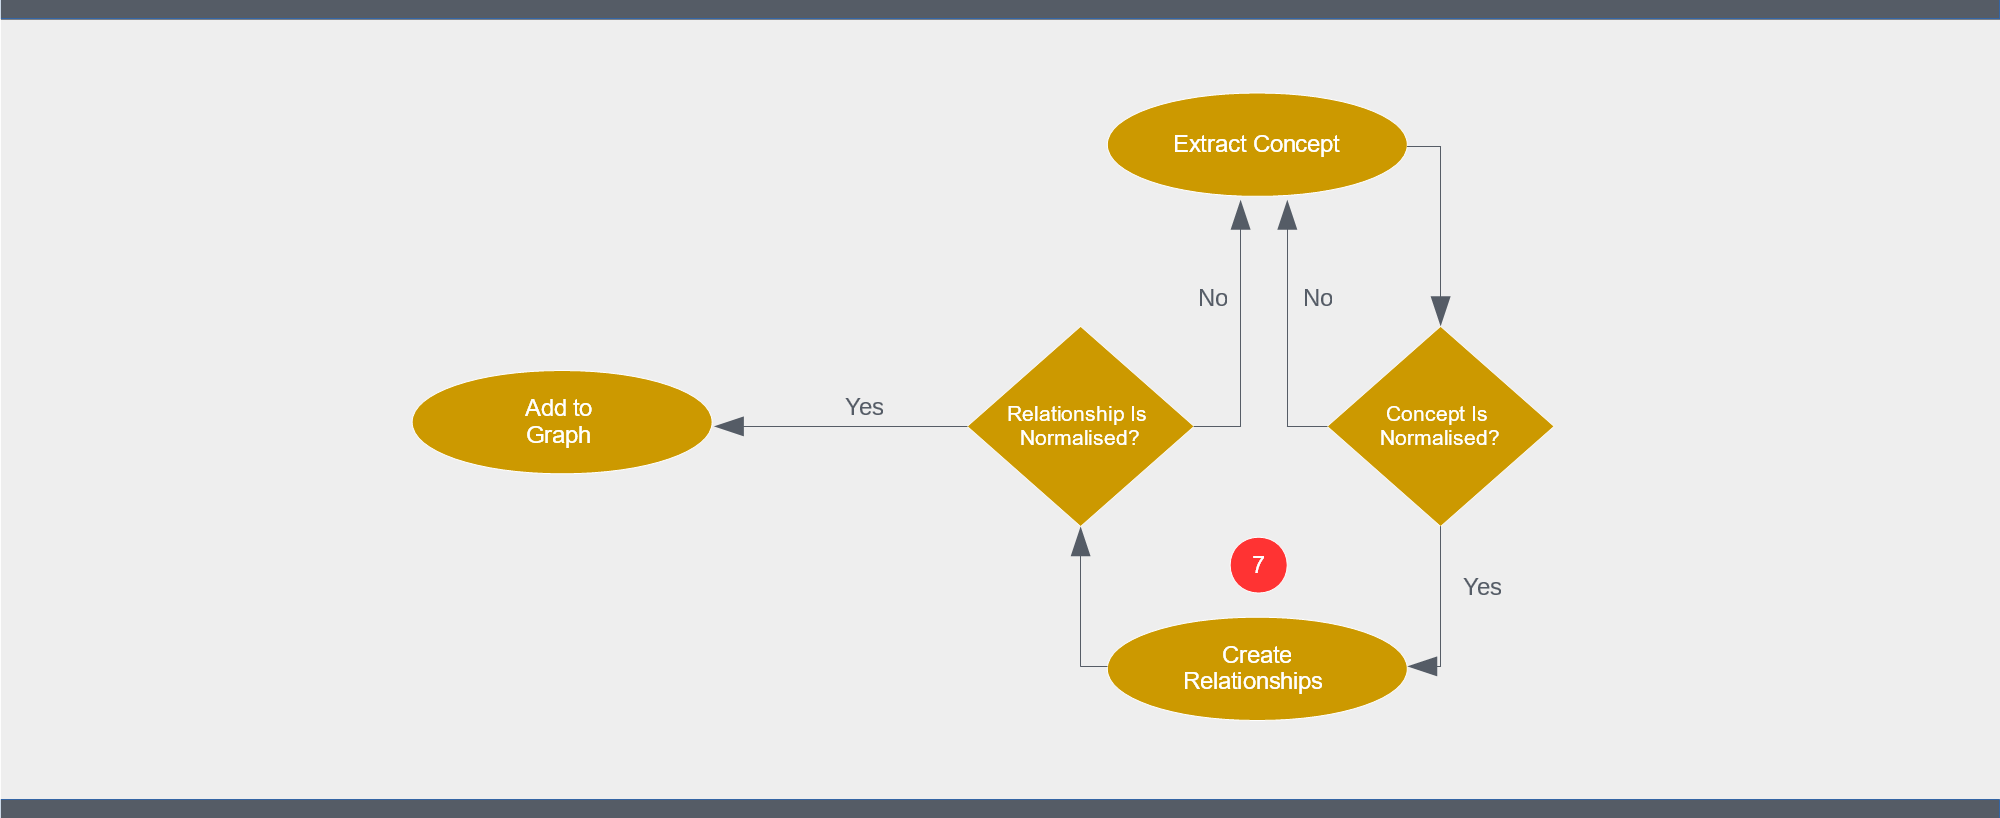
To connect your new concept to the graph, you’ll need at least one relationship. Start by choosing one or more describing concepts from your existing graph. These will usually be from your Initial Framework. If your graph is for human use, consider whether you should introduce a chunking-suitable concept between the descriptor and your new concept.
Attach to these describing concepts using Simple Containment (is of), Subsumption (is a) or Composition (part of).
Once your new concept is properly described within the graph, you can start making “fact” connections.
Before making these connections, consider how well defined they really need to be. A detailed relationship – the predicate in an RDF triple or the property in a property graph – is often not required. If we have a “person” concept and a concept described as “email”, for example, it usually makes no sense to record a “has_email” predicate or property with the relationship connecting them.
If the relationship needs detail, it’s important that this detail is reified if required and properly normalised. This can be an intimidating task initially for your team members, but there’s no better teacher than a good set of examples. If your evolving graph has been assembled using these standards your team can easily explore it to find an example that helps them with the concept they’re working on.
Step 8: Publish Your Graph
Your knowledge graph will never be completely finished. Editing concepts and facts will be an ongoing process. New projects and use cases will also periodically expand the scope of your graph.
If your graph meets the objectives defined in Step 1. however, it’s now ready for use.
Creating an Enterprise Knowledge Graph can seem like an overwhelming exercise. But with a little planning and the right tools your team can build one that captures and formalises your organisation's important knowledge. At FactNexus, we're here to help if you need it - with cloud-based tools or professional services.